State of Residential Solar in Ohio : 2024
The State of Residential Solar in Ohio : 2024 report provides a high-level market analysis of the residential solar sector in Ohio. It is designed to be a resource for stakeholders interested in the state's solar trends. Data for the report are derived from interconnection agreements filed with the Public Utilities Commission of Ohio.
Statistics highlighted here are available at the regional, county, city, and census tract level.
Data Limitations
This report acknowledges limitations in the data due to potential miscategorization within interconnection agreements. For example, a commercial entity receiving a residential electricity rate might have a corresponding residential interconnection agreement, even though the application is commercial use.
As well, solar installations that do not have an interconnection agreement filed with the PUCO are not included in the analysis.
Ohio’s Residential Market
Growth in 2024
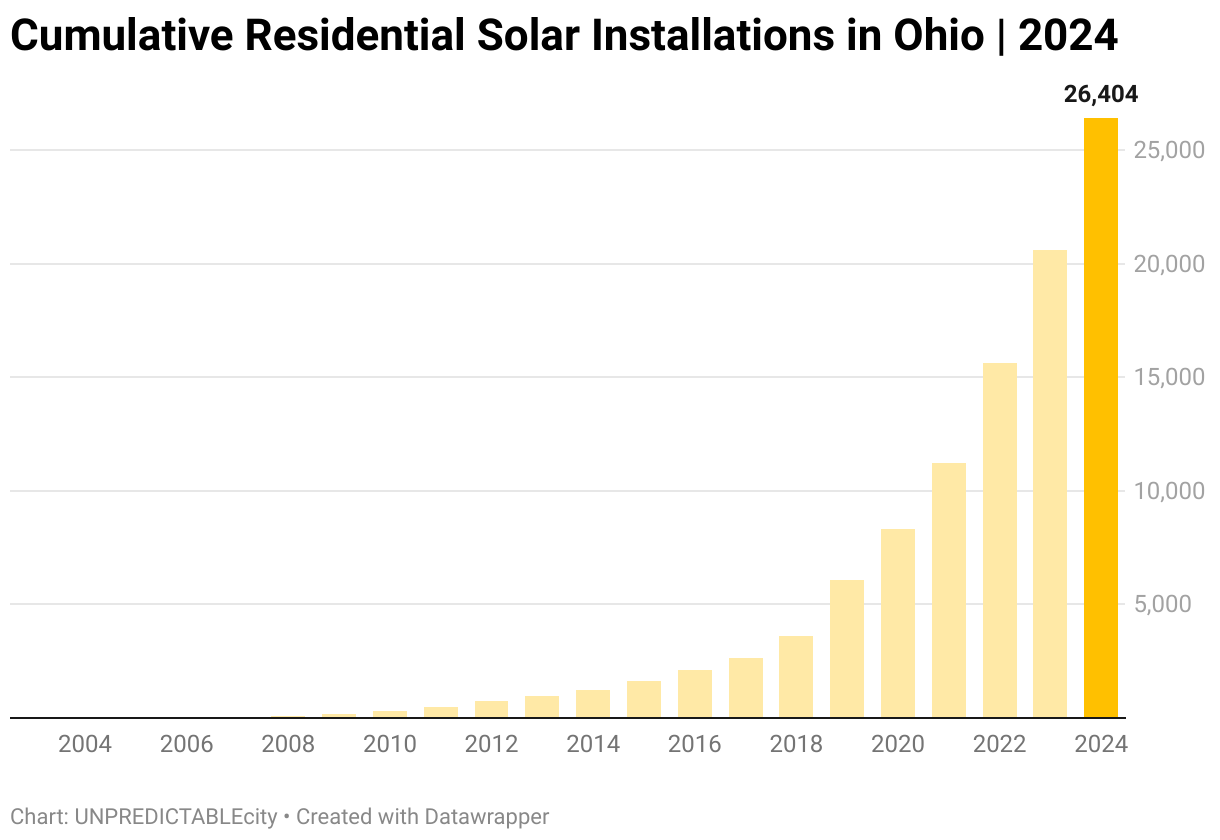
In 2024, Ohio's residential solar sector saw significant growth, with the addition of 5,797 new solar interconnections and 85 interconnection expansions. This brings the cumulative total of residential solar installations with an interconnection agreement to 26,404 in the state. Notably, this represents a 28.1% increase in interconnections compared to 2023.
Short-Term Trend
Since 2020, Ohio has experienced a surge in residential solar adoption. A total of 20,352 new installations were added during this period, representing 77.1% of all residential solar installations in the state. This translates to an impressive average annual growth rate of 34.3%.

Adoption Rate
Furthermore, the statewide adoption rate of solar energy, measured by installations per occupied household, has reached 0.55%. This marks a 322.4% increase from the adoption rate observed in 2019.

Capacity Growth
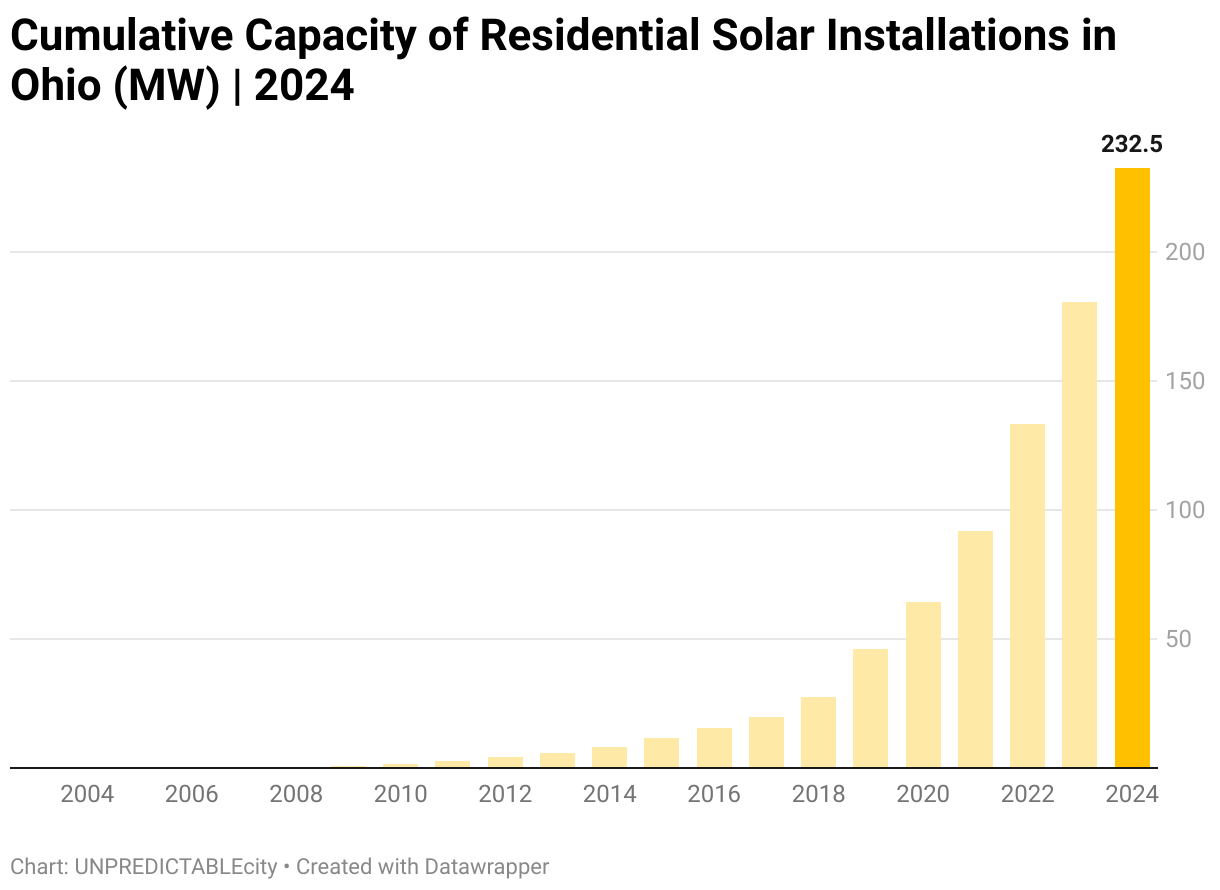
Ohio's residential solar capacity witnessed significant growth in 2024 as well. A total of 52.1 MW of new capacity was added through new and expansion interconnection agreements, bringing the statewide total capacity to 232.5 MW. This translates to a notable 28.9% increase in capacity compared to 2023.

System Size Trends
The average capacity per installation has begun to drop in 2024, returning to around 8.9 KW. This however, is still a 17.9% increase in the average size of residential solar systems over 2019.

Environmental and Economic Benefits
These residential solar installations are estimated to generate a substantial 302.7 GWh of electricity per year. This clean energy production equates to roughly 0.4% of the total retail electricity sales to residential customers in Ohio. Additionally, it is estimated to deliver significant cost savings, with customers saving over $48.6 million annually on their utility bills. Furthermore, residential solar in Ohio is estimated to have offset 131,037 metric tons of carbon dioxide equivalents in 2024.


Cost Trends
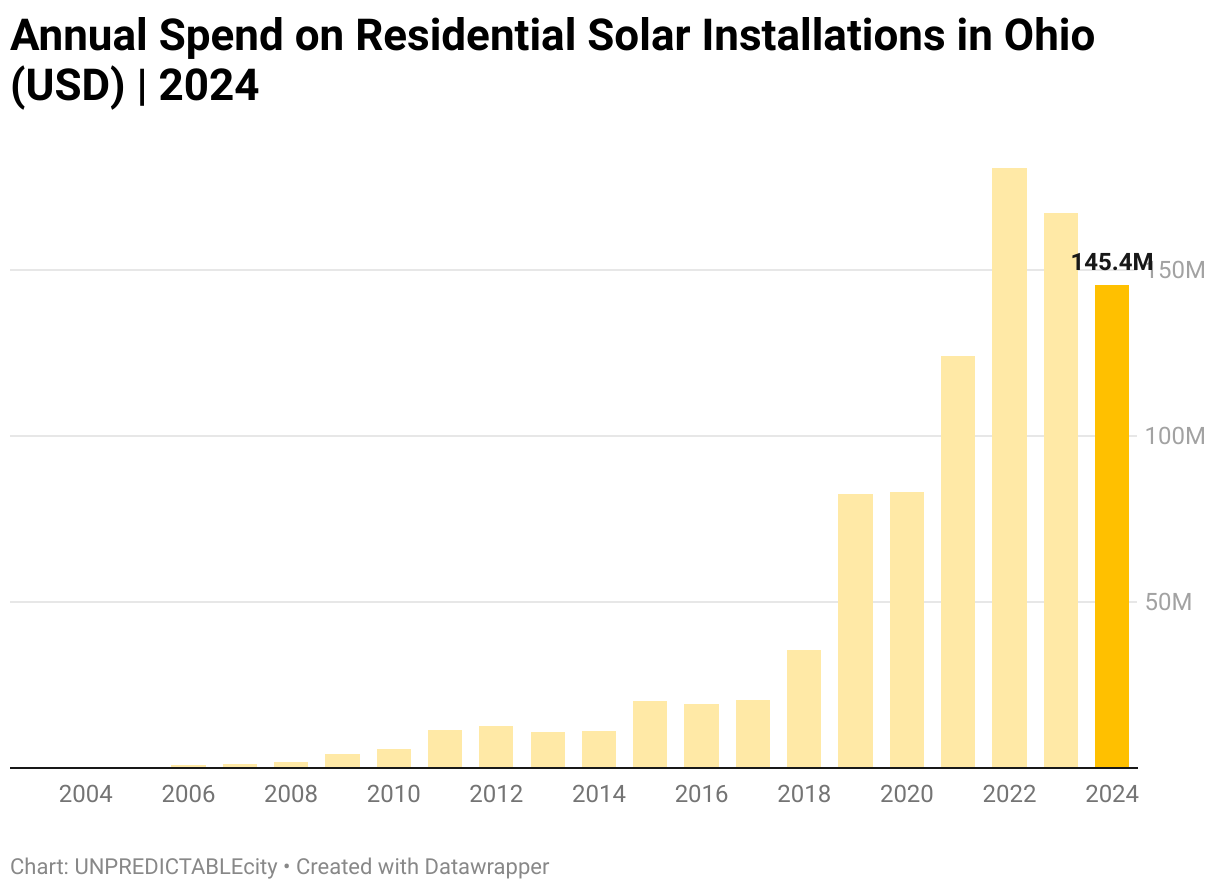
It's important to note that despite the significant increase in new installations, the total expenditure on residential solar decreased again in 2024. This trend is attributed to a decline in the average cost of installation per watt. In 2024, residential customers spent a total of $145.4 million on new solar installations, down from $167.1 million in 2023.
For more information regarding residential, commercial, and utility scale solar trends in Ohio, please contact UNPREDICTABLEcity.
Authors
Lucien d’Aversa - Lead Consultant
Jon-Paul d’Aversa - Principal
About Us
UNPREDICTABLEcity offers comprehensive climate action services. Our team of dedicated environmental consultants works closely with clients to develop tailored solutions with one goal in mind: bring clarity to the complex nature of planning for the future. The annual State of Residential Solar in Ohio report provides our clients with data to complement community-driven solar market development.